// DATA · 2026
Polymarket Lab
A self-hosted strategy lab for prediction markets — live order books, 1.64M labelled markets and a fleet of trading experiments run like science.
- Python
- FastAPI
- PostgreSQL
- Redis Streams
- WebSockets
- React
- Docker
- WireGuard
- Experiment design
- Quant research
- Risk management
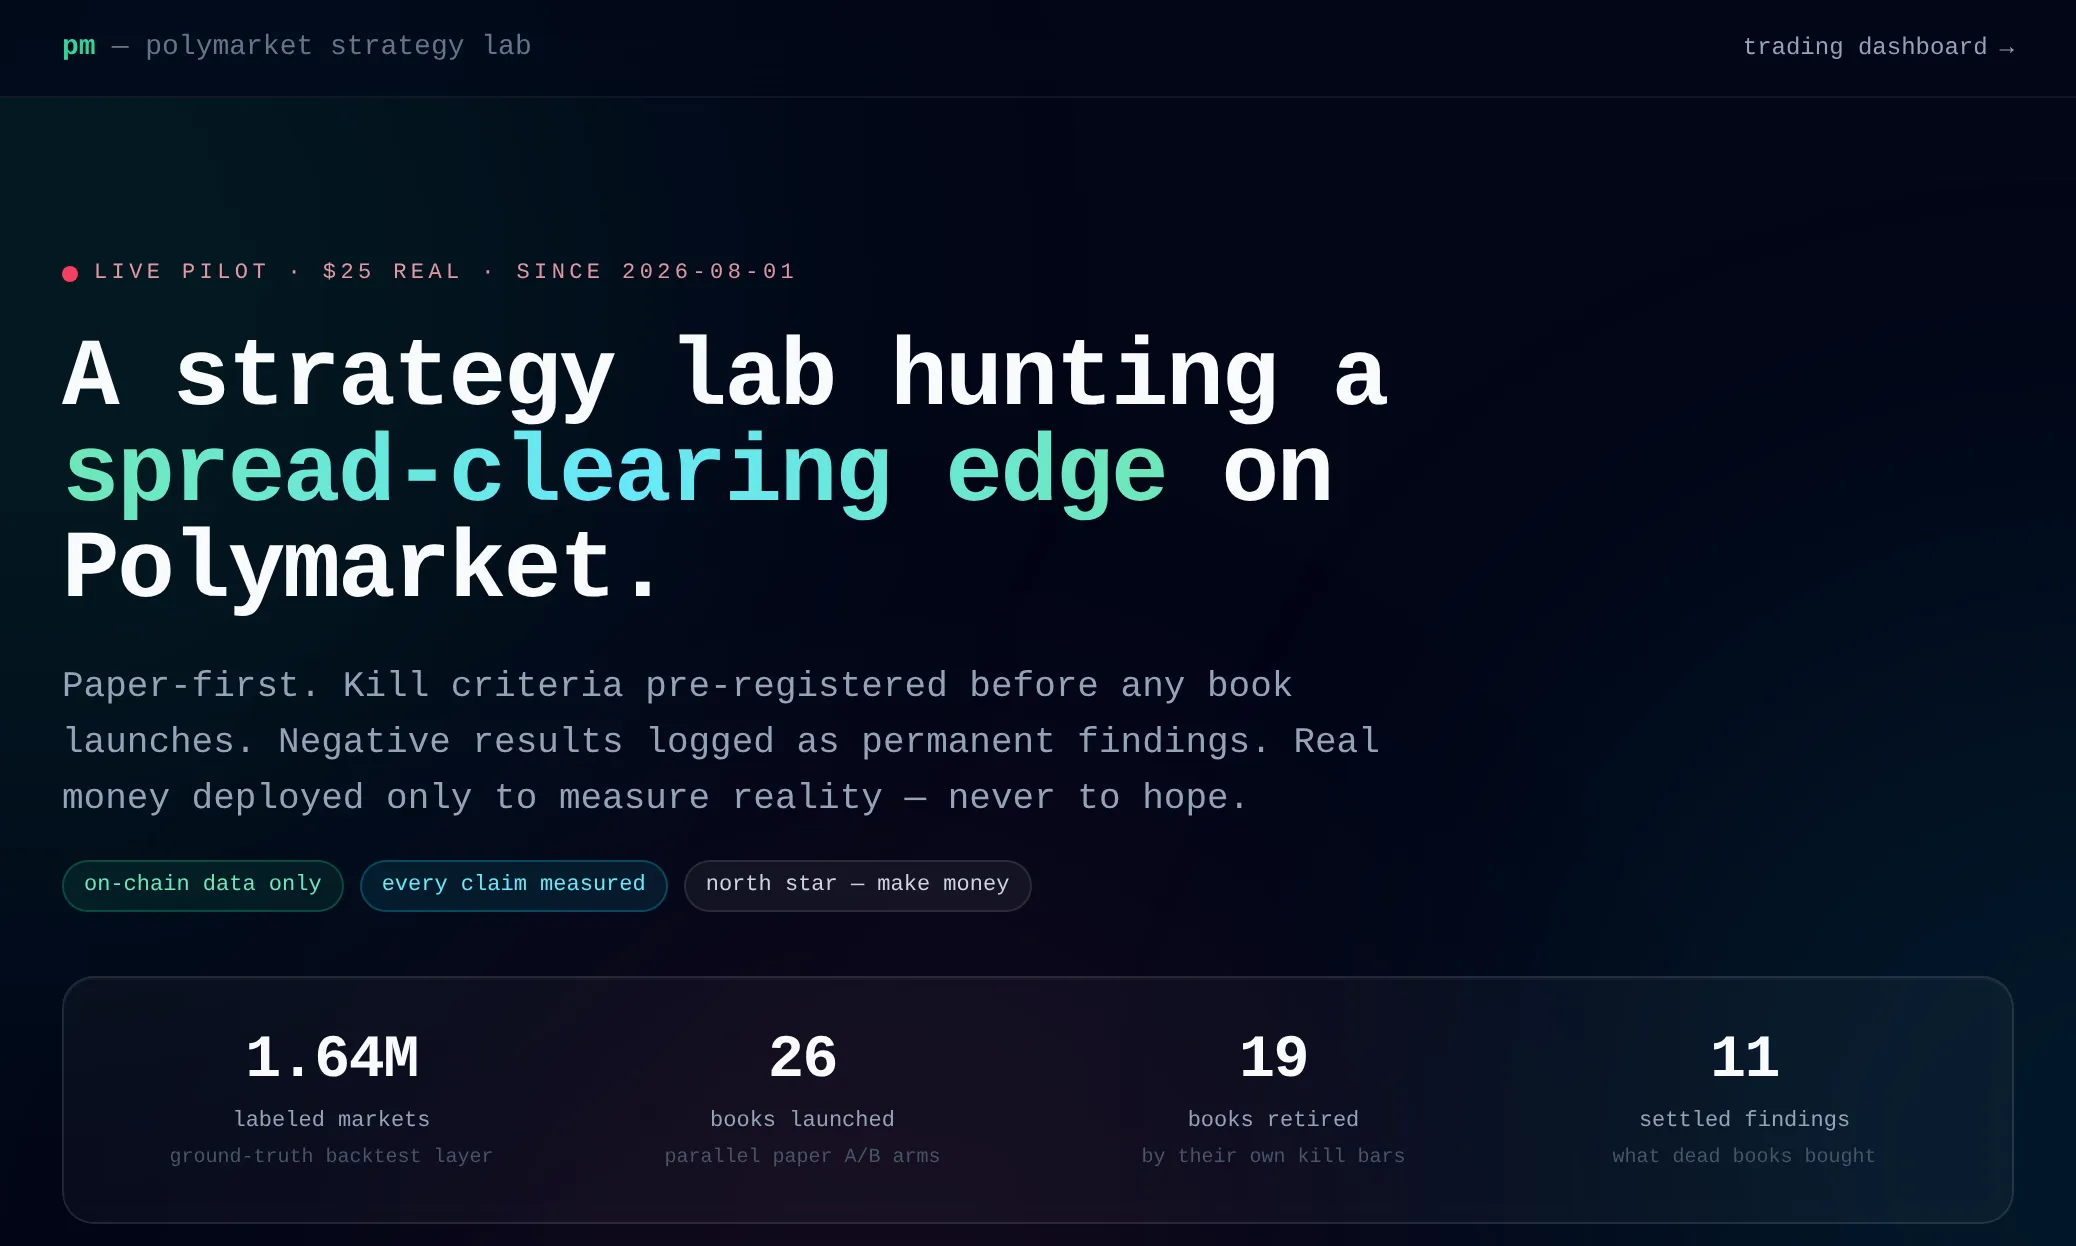
Prediction markets are thin, fast and full of retail flow — the kind of venue where a careful operator should be able to find an edge. I built a self-hosted lab to hunt for one on Polymarket, and ran it like a research programme: every idea a hypothesis, every hypothesis with a written kill bar.
The platform
A Python pipeline polled the top 500 markets every five minutes and streamed live order books from Polymarket’s CLOB over WebSocket, tracked large-wallet fills, and stored it all in Postgres — 6.4M market snapshots and a ground-truth set of 1.64M resolved markets for honest backtests. Redis Streams carried events between workers.
On top ran a fleet of 26 paper-trading books, many side by side as A/B arms — mean-reversion fades, favourite carry, whale-copy, news and LLM signals — all from one container image configured per book. A FastAPI + React dashboard tracked each book’s equity, positions and trades (the dashboard shots here run the real UI on sample data, since the lab’s database is archived offline); a Telegram bot sent digests, fills and kill-line alerts.
The whole thing ran in Docker Compose on a 4-core LattePanda in a closet, with nightly encrypted backups. Real orders went out through a separate WireGuard stack with a kill-switch, so the live path was isolated from everything else.
The method
Every strategy went through the same loop: a research spike backtested on true-label outcomes; a paper book with one variable per A/B arm and a kill bar written down before launch; a scheduled review where books were judged by their own criteria; then graduate or retire, with the lesson logged as a permanent finding. Over eleven weeks that loop launched 26 books, retired them on evidence, and produced twelve settled findings.
The live step was a $25 pilot: real orders, each one mirrored into a paper twin, so the gap between the two books measured the exact cost of touching the real market.
What it found
The most valuable result was about measurement itself. Running the same signals through three fill models at once showed that filling at the snapshot price — the way most paper-trading setups do — made a losing strategy look like a winner: +$54 on paper versus −$58 once each fill walked the real order book. The live pilot agreed with the honest model. Building that simulator is what made the difference visible.
The programme’s conclusion was that, at retail latency, directional trading on this venue doesn’t clear its costs — but it identified the one opportunity that does: market-making for Polymarket’s liquidity-rewards pools, measured at $6–400 a day on deep, slow markets. The whole answer cost about $40 all-in.
Why it’s here
It’s the project that best shows how I work: build the instrumentation first, decide in advance what would prove me wrong, measure reality rather than the model, and stop when the evidence says so.
Gallery
The dashboard mid-run: one card per active paper book, ranked by score (real UI, illustrative data)